Buying a primary residence - what Redfin, Zillow and Realtor can’t show you
Buying a primary residence is a tricky ‘problem’ - one that involves some (data) science and some art. After deciding a budget, every individual starts their search on Redfin, Zillow or Realtor. However, the information presented in these websites is limited by the Fair Housing Act.
Choosing the house first using any of these sites, and then zooming out to the city may be inefficient for two reasons: 1) Computational: searching the entire database for the house that fits the criteria is computationally expensive (the computation may be repeated a few times), 2) Other criteria fit: the perfect house may be in the wrong city/location. A better solution is to choose a city first before choosing the house - on a high level this accounts for jobs/economic activity, crime, natural hazards, etc.
Picking the city before the house
Choosing the right city is yet another challenging ‘problem’ - there’s no definitive answer. State and local government policies play a significant role in determining the future of a city. Understanding the philosophy of a city can provide hints, but there’s no way to accurately predict the future (unless insider information is available).
Zooming in to the (data) science rather than the art, long term living in a city is governed by a few factors other than the house itself (ignoring price, square footage, etc.): jobs/economic activity, natural hazard risk, cost of living, crime, population growth, etc. Here are a few factors (along with links to free data sources):
- National Risk Index: FEMA’s National Risk Index is scored across wildfire, hurricane, tornado, earthquake, extreme heat, and more. Additional data is available on FEMA website. Most big cities in the USA are prone to natural hazards - choose your poison wisely.
- Median house price and median household income + mortgage rates: Talks about market affordability relative to the jobs in the area. The price usually doesn’t get better over time, but with ~7% mortgage rates (~30y fixed), the traditional <28% DTI isn’t sufficient for healthy finances in today’s world.
- Zillow’s home value index by zip code: Watching a market through a full cycle instead of a single snapshot - the ~2008 crash, the pandemic-era spike, etc. Not all cities are equal!
- Zillow’s market heat index: Rough indicator of buyer/neutral/seller market. Also talks about the highs and lows of the market itself, but a bit shallow because the data starts from 2018.
- Property tax rates by city/state: Gives a rough idea about the yearly non-mortgage expenses associated with the house.
- City and state income tax rates: Another yearly ‘expense’.
None of these numbers mean much in isolation. Also, different people weigh these factors differently.
How to analyze the data?
Let’s take a simple example: Zillow market heat index sorted by the average (top 5 vs USA and bottom 5 vs USA):
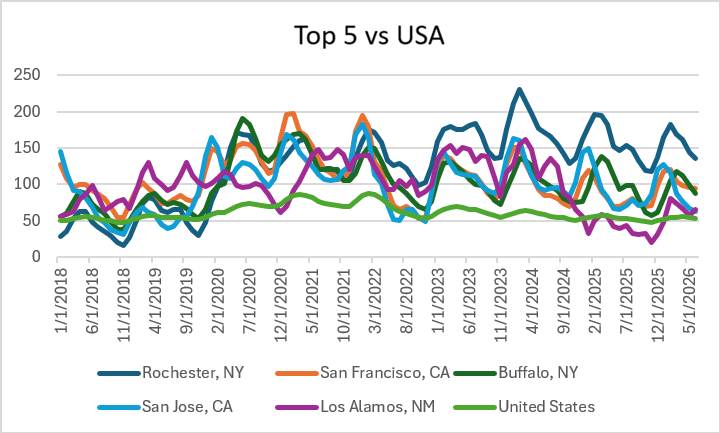
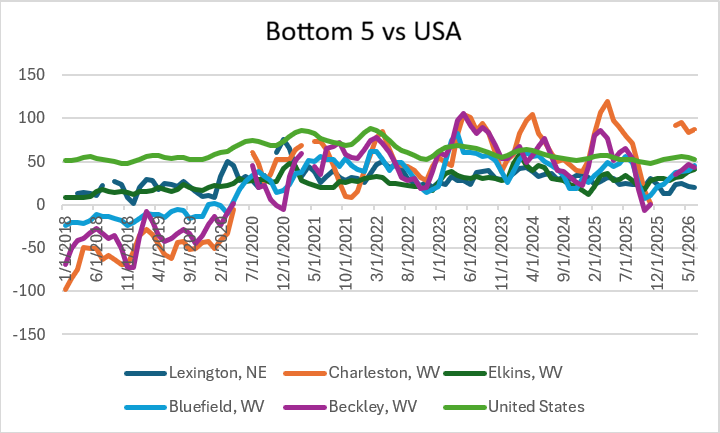
These plots are interesting - the pandemic broke the fundamentals of a few markets. San Francisco and San Jose are currently undergoing corrections with more sellers than buyers, but are still more attractive than the USA on average. However, the price inflation that broke the long-term trend has not been reversed completely in these cities. At the same time, West Virginia is currently undergoing a resurgence with more buyers than sellers despite having a poor job market - probably a testament to the natural beauty of the state.
Takeaway: A ‘simple’ metric can have complex interpretations.
Redfin data is still important!
To the best of my knowledge, Redfin is the only website that allows housing data download in any form - only the favorites, not the complete list.
What can be added on top of your Redfin favorites
- Walk Score, Bike Score and Transit Score: Translated into plain-language bands (Car dependent → Walker’s paradise, Some Transit → Excellent Transit) - Redfin has this data, but the downloaded favorites don’t have it. Walk/bike/transit scores can be acquired from the Walkscore website. The website provides an API for downloading scores by the house’s address.
- Crime history: Instead of one composite “safety” score, collect and analyze incident data month-by-month and year-by-year across different metro areas (eg: Minneapolis crime data). Standardization is required to make the data comparable across cities.
- FEMA’s National Risk Index: Total natural hazard risk can be used to estimate the probability of claim - therefore, this data can be used to estimate the homeowner’s insurance cost.
- FEMA’s official flood hazard boundaries: The actual federal Special Flood Hazard Area data is drawn directly under each listing. Accurate region-wise boundaries can be used to estimate the need for flood insurance.
- Bike and pedestrian infrastructure: This data is provided only by a few cities (eg: Pittsburgh), and it’s not always maintained.
- A neighborhood-scale walkability index from the EPA’s national Smart Location Database. It’s built on Census Bureau block-group geography, so it adds context for the surrounding area, not just the one parcel.
- Market context related to ‘favorites’: Current status (active, pending, sold) and price history attached to each home. Some cities provide updated data (eg: Allegheny County), but not all.
Bringing all the pieces together
It’s tempting to assume Redfin, Zillow and Realtor just haven’t built this yet. Fair housing law puts real limits on what a real estate business can say — and in some cases what data it’s safe to surface at all. Those limits explain most of what’s missing from every major listing site.
The following are limitations that Redfin/Zillow/Realtor are not allowed to sidestep:
- Agents and platforms are trained not to characterize a neighborhood’s desirability: Standard fair housing training built into the NAR Code of Ethics cannot include terms such as safety, family-friendliness or any form of financial advice, because language exactly like this has a documented history of functioning as coded steering — intentional or not.
- What they are allowed to show, and do show: Objective, third-party-sourced facts — square footage, tax records, price history, test-score-based school ratings from providers like GreatSchools. However, it’s still missing a lot of context. The city-level price, income and tax numbers described above sit comfortably in that same category — aggregate, government-sourced statistics that say something about cost, not about who lives where.
The annoying part
The problem with house purchases is that people don’t set their criteria correctly. They lookup a few options in the database, over-index on a few factors they heard about in the news/articles, and end up buying a house that doesn’t fit their criteria. The problem is that the authors of those articles have vested interests in those markets - they directly (realtors) or indirectly (media) profit from sales in the market. The most annoying part is that a few people monetize this opportunity to make a quick buck - the data are freely available to the public. In the age of vibe coding there should be no barriers to collecting and using data for your own purposes.
Introducing my app
Over the years I built a simple dashboard app that visualizes some of the above data and allows you to filter and sort the results. The app code is freely available to the public here - the app was ‘hand coded’ over several months, and was improved using AI generated code. Happy house hunting!
Important note: (Data) Science doesn’t replace the art. Having a good realtor, visiting the houses and due diligence (home inspections, etc.) are still important.