In my previous post about a reinforcement learning agent for ATC, I described the repo I built to download ADS-B tracks, label them and prepare them for analysis. Recently, I used LLM coding agents to build usable trajectory templates from those labeled tracks.
Improved preprocessing #
ADS-B data is unusually noisy - there can be significant jumps in longitude, latitude or altitude for a seemingly ordinary aircraft. So I used LLM coding agents to write track-quality checks that flag those cases without overwriting the reported measurements.
The checks split tracks at large gaps, flag implausible positions and altitude changes and identify isolated altitude spikes. ADS-B reported values stay intact; this sets up the data for future analysis - flight-phase estimation/prediction can use neighboring samples to correct a spike.
Bug fixes #
I used LLM coding agents to identify and correct the order of coordinates used in distance calculations and made the conversion from sample intervals to ground speed consistent. I also fixed a time-unit error in optional landing cleanup and repaired the aircraft-visualization flow. Regression tests now cover track gaps, jumps, touchdown segmentation, and coordinate handling.
Quality flags do not discard an entire session. The full-sector export reported 17,013 flagged points; unusable altitude samples are omitted from plotted trajectories, while the session-level quality summary remains available for later analysis.
Define what counts as a complete session #
The original data set was captured across several days. Previously each data point was labeled with ‘session_id’ which differentiates hops of the same flight. Now each session is labeled with ‘session_type’ that belongs to one of the following categories:
| Label | Session type | Side notes |
|---|---|---|
| S1 | Takeoff and landing in the sector | Both events must be present. |
| S2 | Arrival | Landing event observed; inbound start is inferred where edge samples are absent. |
| S3 | Departure | Takeoff event observed; sector exit is inferred where edge samples are absent. |
| S4 | Airborne pass-through | No local takeoff or landing event. |
| Shared checks | Labels are checked against event counts and track coverage. | Collection-window clips, contradictory labels, S3/S4 tracks that leave and re-enter under one session ID, and near-ground sessions without takeoff or landing are excluded. |
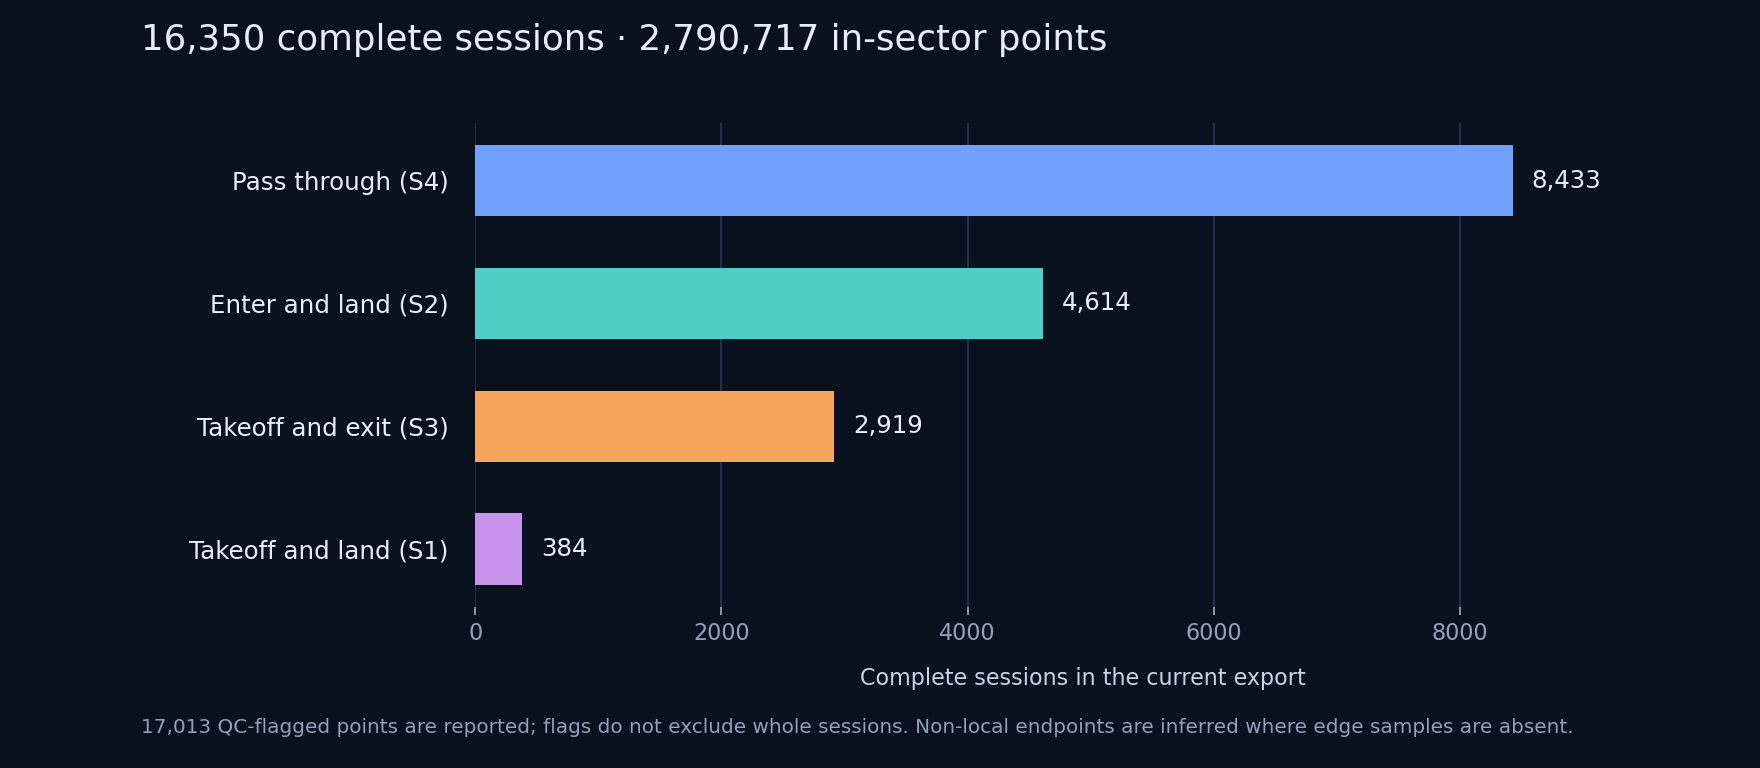
In the full-sector export used for the counts below, none of the samples fall in the configured sector edge bands. Arrival, departure and pass-through endpoints were therefore inferred from session labels and observed track boundaries, not measured at the sector edge.
In the past (~2019) I discretized the space using equal number of splits along the latitude and longitude axes. Now I introduced discrete and continuous space variants along with a discrete five-second time base. To understand the commonalities better, each aircraft’s time axis was zero-normalized to the ‘session start’ time.
In the full-sector export, pass-throughs were the largest category, followed by arrivals and then departures. That may reflect how session_id was assigned. In theory, the total inflow into the sector should be close to the outflow unless aircraft spend a lot of time parked there, which I don’t think is happening.
Compare the XY (lon-lat) and XYZ (lon-lat-alt) templates #
The continuous-space and discrete-space viewers handle all four categories. Each puts an XY view beside an XYZ view, but the panels build their route templates independently. The left panel groups in longitude/latitude space; the right groups in longitude/latitude/altitude, with vertical scale emphasized so climb and descent are visible.
Prominent route lines are displayed - line width in 2D and brightness in 3D indicate how many sessions reuse a template. The animation below is a story render from the newer JFK-filtered continuous export: 1,828 sessions, including 1,053 arrivals. At Broad tolerance (35 km), the arrivals produce 14 XY templates and 14 XYZ templates. The groupings are independent, so matching counts do not mean matching membership.
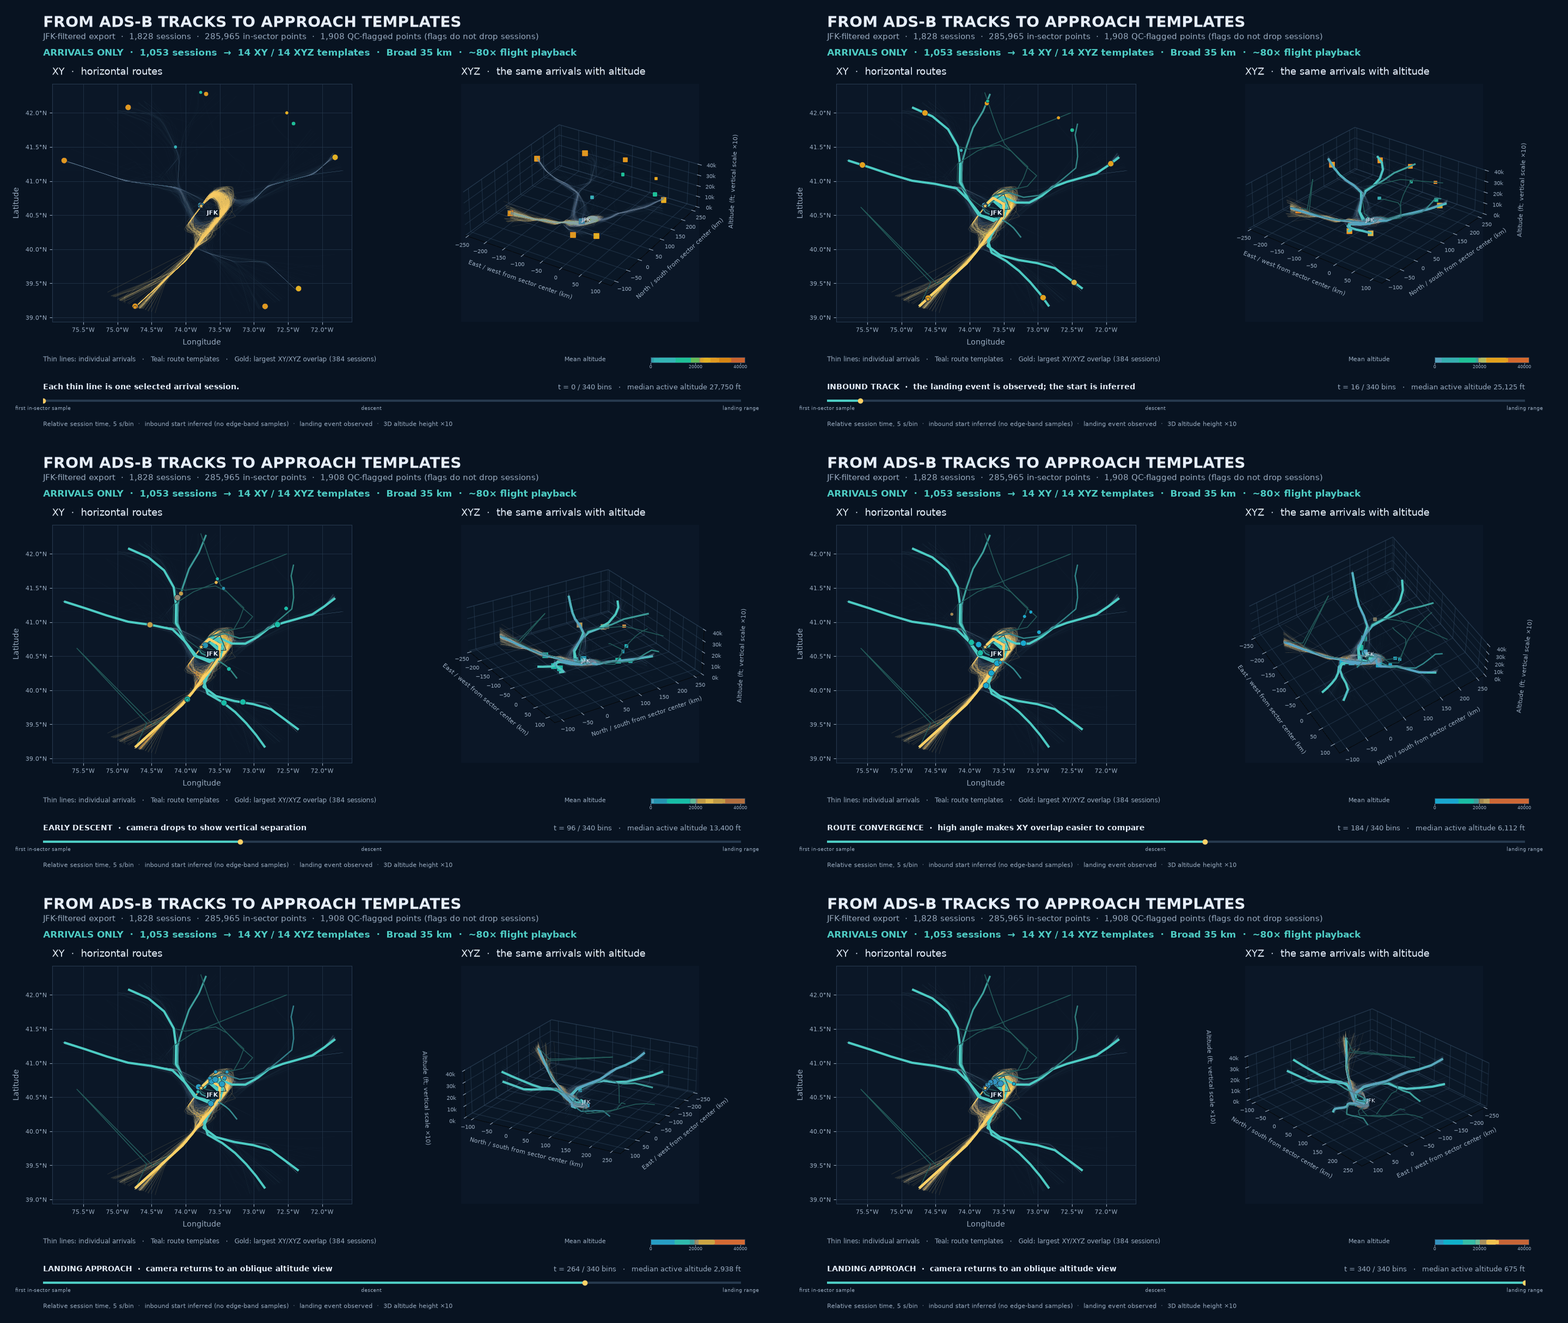
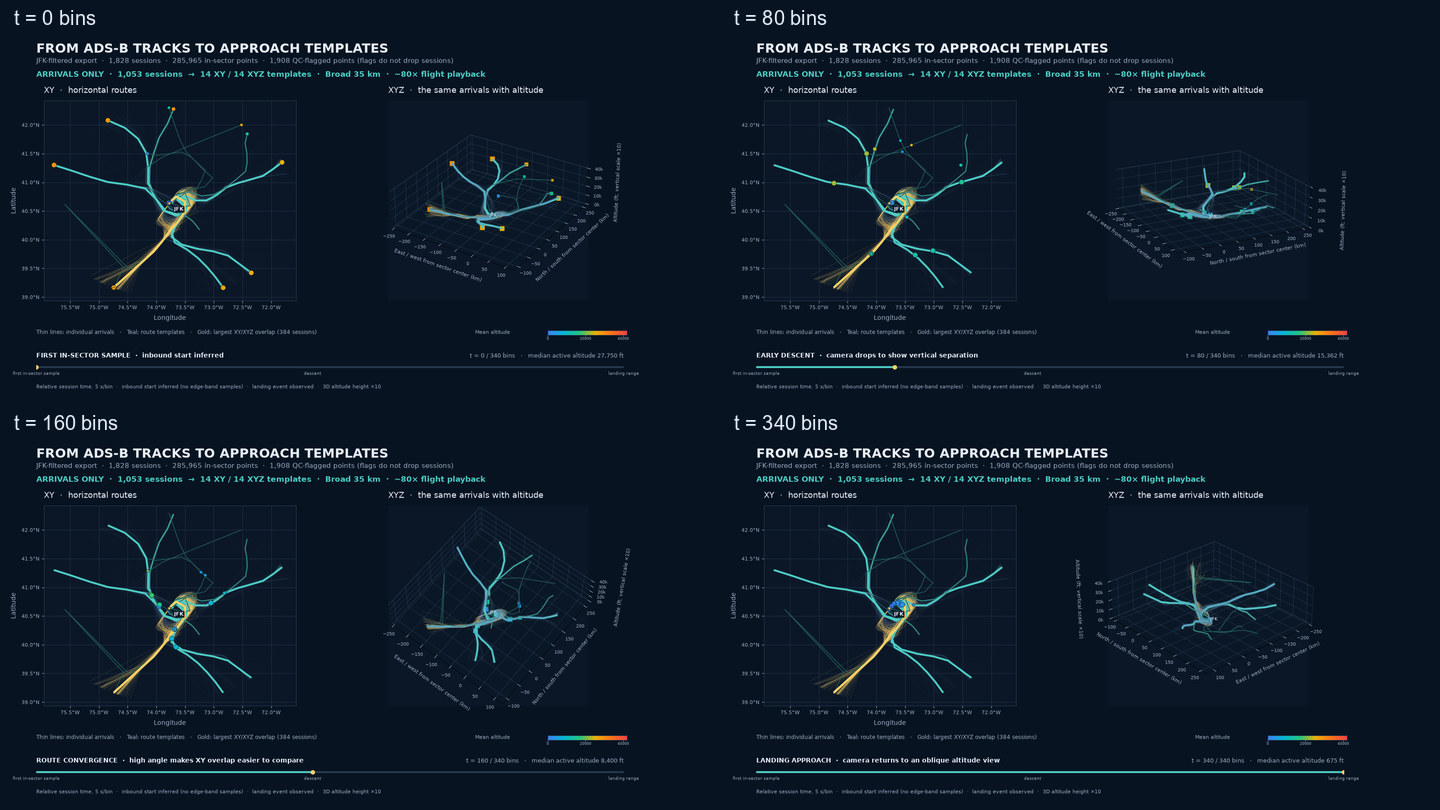
I timed the camera turns around the descent so the altitude separation and convergence toward the airports are easier to see.
FlightPathAnalysis is still a tool meant only for data exploration - it collects data, prepares and inspects candidate trajectories; the controller work stays separate. The code and export workflow are in FlightPathAnalysis repo on GitHub.