In my previous post, I broke aggregated route templates down into individual flights, tracing divergent tracks and monitoring traffic separation.
To build an automated controller or an RL policy, an agent cannot operate on raw coordinates alone. It must project an aircraft onto a valid template trajectory and establish its along-track distance-to-touchdown (DTG).
In terminal airspace, multiple arrival templates cross near identical coordinates. An aircraft cannot simply transition to any nearby path. Its heading, speed, altitude and descent capability dictate which template paths are physically flyable and which are impossible.
I updated FlightPathAnalysis to evaluate that feasibility, compute along-template distance-to-go and estimate vertical operating corridors with quantile regression.
Why altitude vs. radial distance failed #
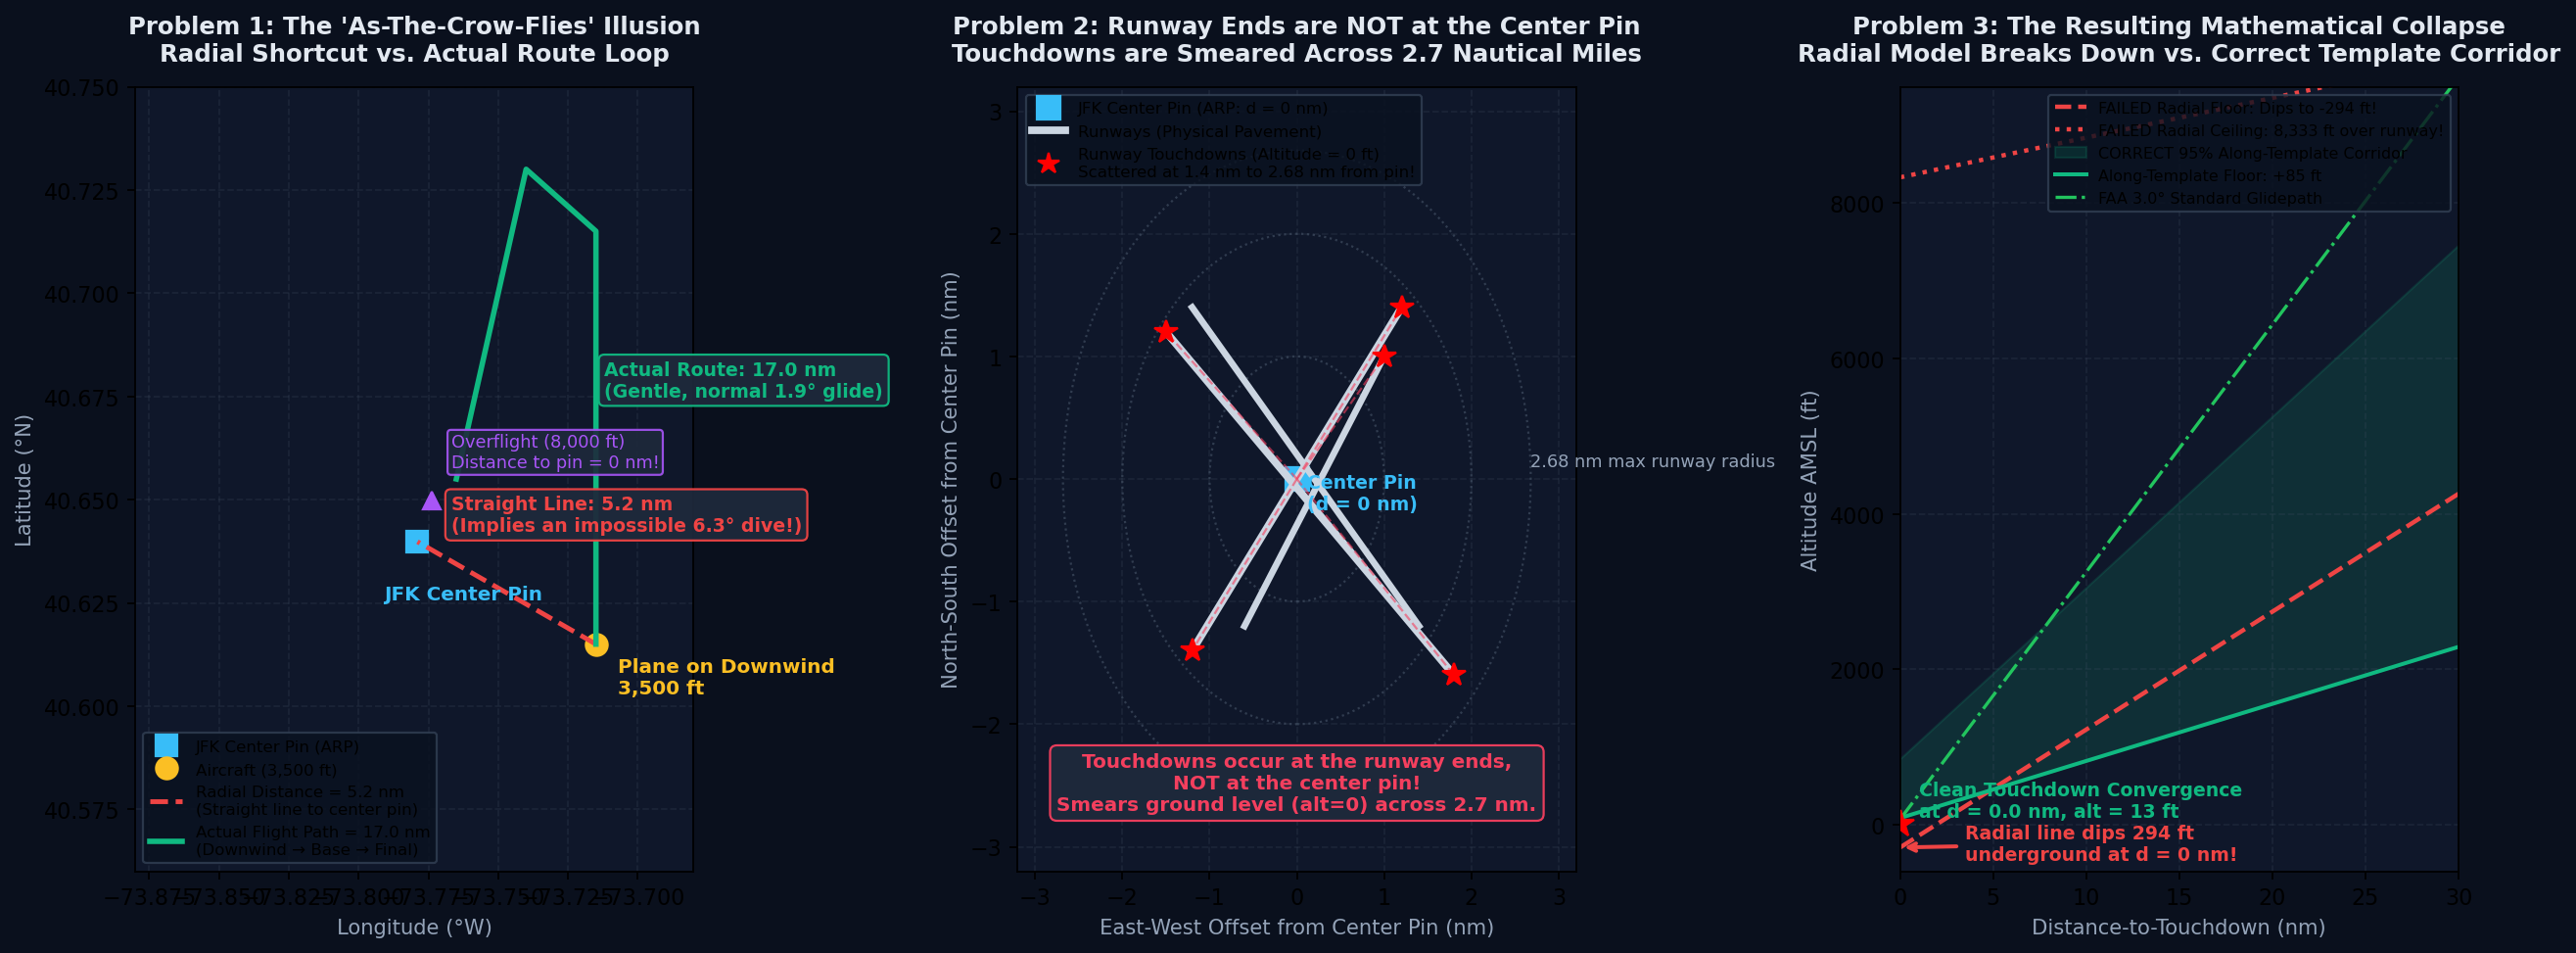
My first attempt to model approach profiles plotted altitude directly against straight-line distance to the JFK Airport Reference Point (ARP: 40.639751, -73.778925).
That setup failed. When fitting linear quantile regression models ($q=0.025$ and $q=0.975$) to radial descent profiles, the 2.5th percentile floor dropped below ground to $-294\text{ ft}$ at zero distance, while the 97.5th percentile ceiling rose to $8,333\text{ ft}$.
An envelope spanning from $-300\text{ ft}$ to $+8,300\text{ ft}$ over the runway gives no usable boundary. Two geometric factors caused this breakdown:
-
Straight-line radial shortcut: Aircraft do not fly direct radials to the airport center; they follow standard terminal arrival routes with downwind, base and final legs. An aircraft flying downwind abeam JFK at 3,500 ft has a straight-line radial distance to the ARP of only 5.2 nm, which falsely implies an unrealistic 6.3° dive. Along its true flight path, it has 17.0 nm to fly to touchdown, matching a standard 1.9° descent. Similarly, pass-through flights crossing the sector at 8,000 ft pass within 1 nm of the ARP at high altitude, falsely inflating the upper quantile ceiling over the airport.
-
Runway threshold spread: The ARP is an arbitrary center point, while JFK operates four runways whose thresholds lie between 0.2 nm and 2.68 nm from that center. Aircraft touch down at ground elevation across this 2.5 nm span. That spread smears zero altitude along the horizontal axis, pulling linear regression intercepts negative at $d = 0$.
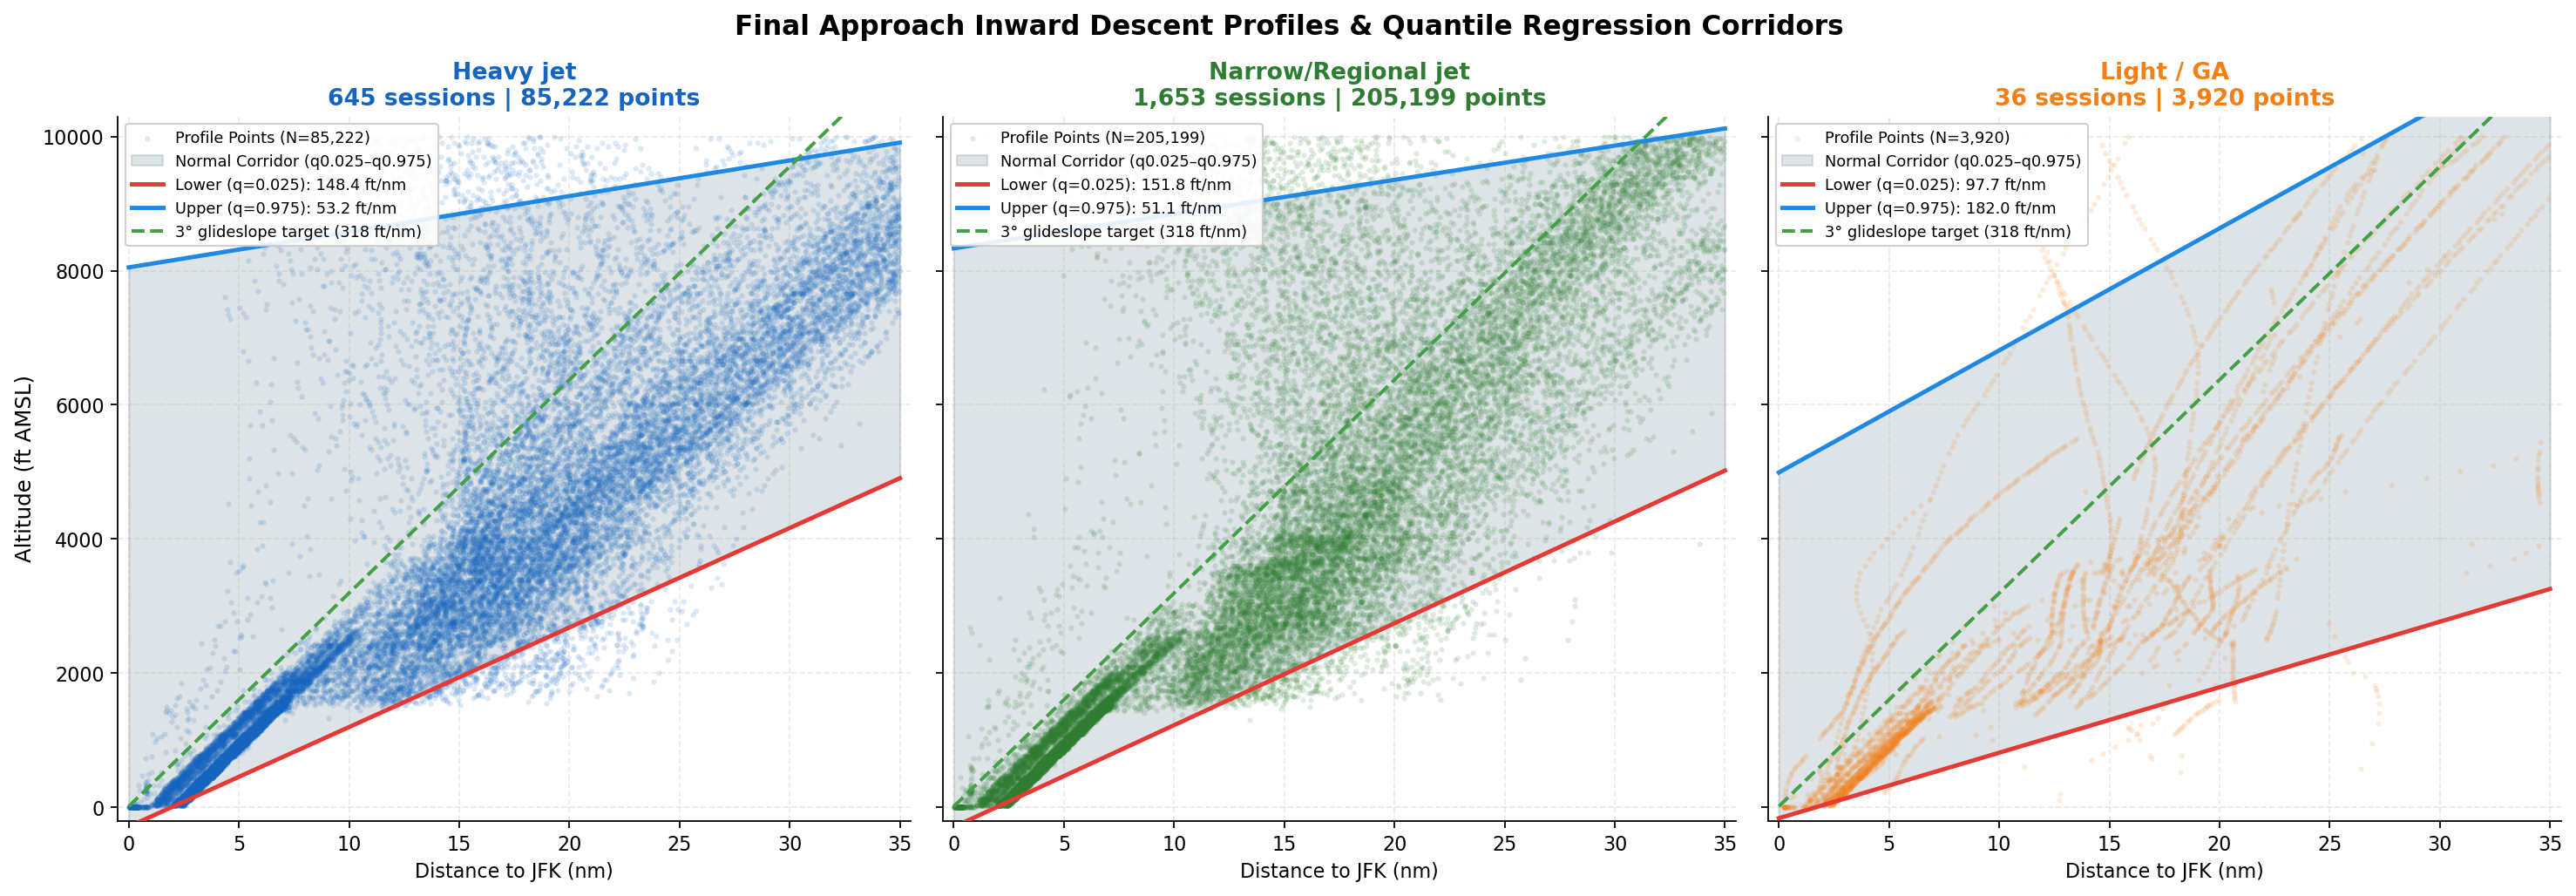
Descent profiles must therefore be parameterized by along-template distance-to-touchdown ($d_{\text{DTG}}$), which requires identifying which template trajectory the aircraft can fly.
Evaluating physical feasibility at a waypoint #
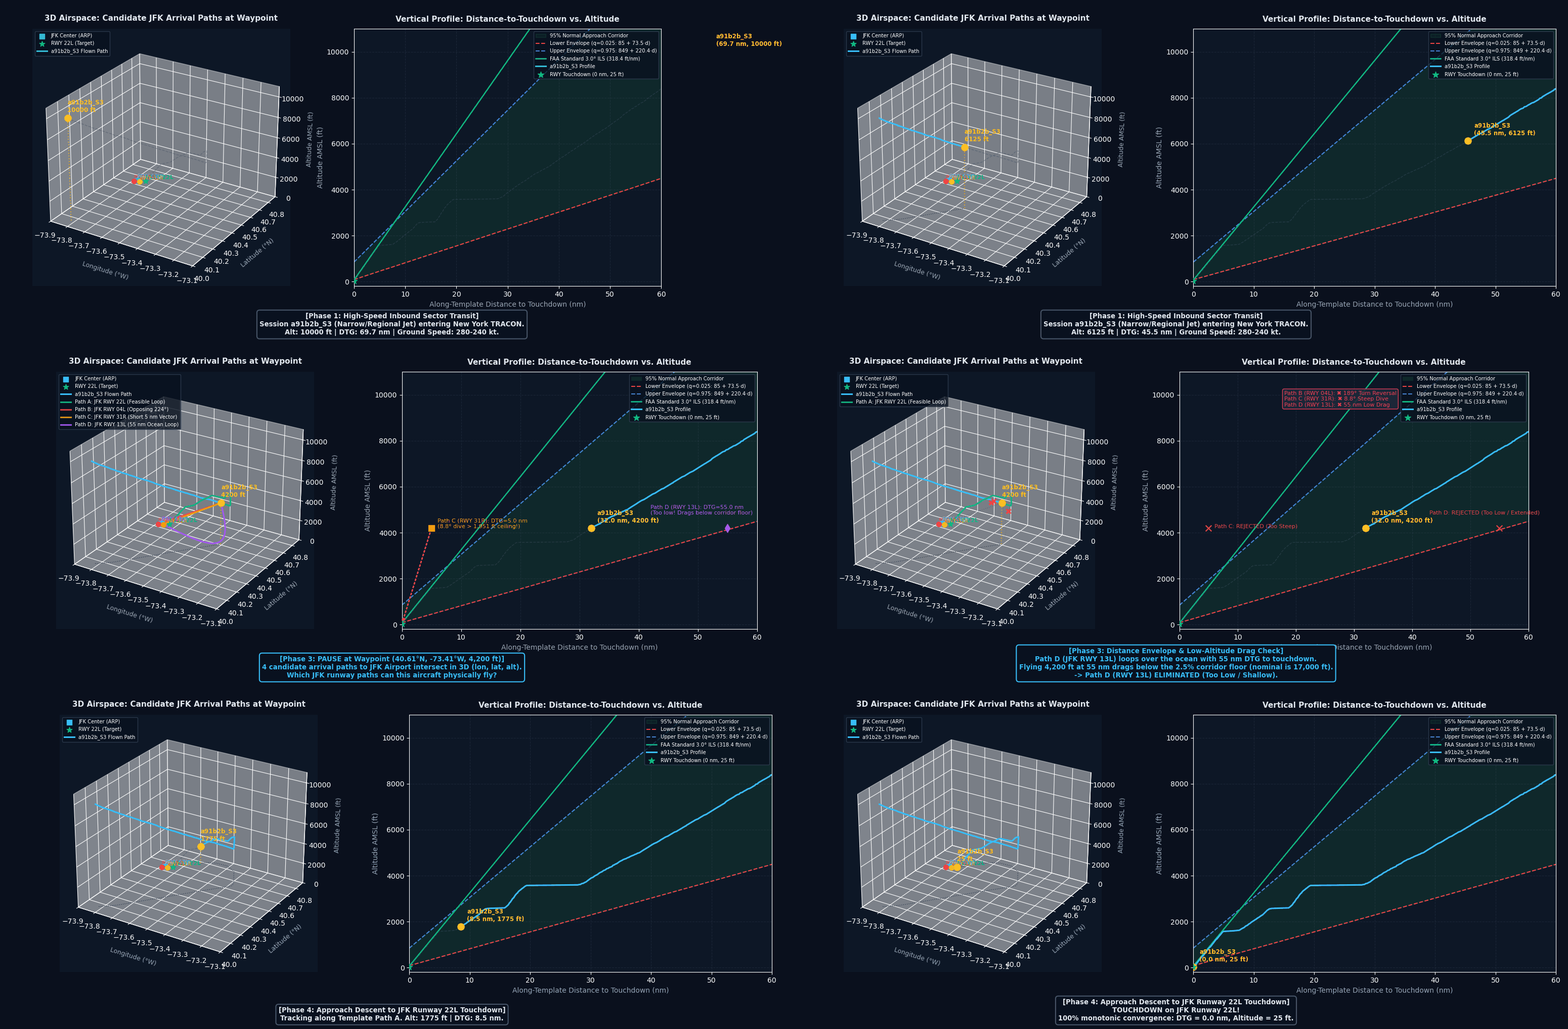
Candidate paths that do not land at JFK are excluded from the start.
In the animation above, session a91b2b_S3 (a narrow-body jet) enters New York airspace from the south at 10,000 ft and reaches waypoint $P = (40.61^\circ\text{N}, -73.41^\circ\text{W}, 4,200\text{ ft})$ flying northeast on heading 035°.
Four candidate template paths cross this point, all terminating at JFK runways:
-
Turn limit: Template Path B leads straight in to Runway 04L on heading 224°. Intercepting it requires an immediate 189° reversal, exceeding the 8° narrow-body bank limit and 1.5°/s turn rate. Path B is eliminated.
-
Glidepath ceiling: Template Path C cuts to a short final for Runway 31R with only 5.0 nm along-track distance to touchdown. Reaching the threshold from 4,200 ft requires an 8.8° dive ($830\text{ ft/nm}$), breaching the 97.5th percentile corridor ceiling ($1,951\text{ ft}$ at 5.0 nm). Path C is eliminated.
-
Corridor floor: Template Path D loops east over the ocean before approaching Runway 13L, stretching distance-to-touchdown to 55 nm. At 4,200 ft, the aircraft sits well below the 2.5th percentile corridor floor. Path D is eliminated.
That leaves Template Path A (JFK Runway 22L, 32.0 nm DTG, 1.8° descent), which the aircraft follows through base turn and localizer capture to touchdown ($d = 0.0\text{ nm}, \text{alt} = 25\text{ ft}$).
Landing audit and the 2.8 nm cutoff #
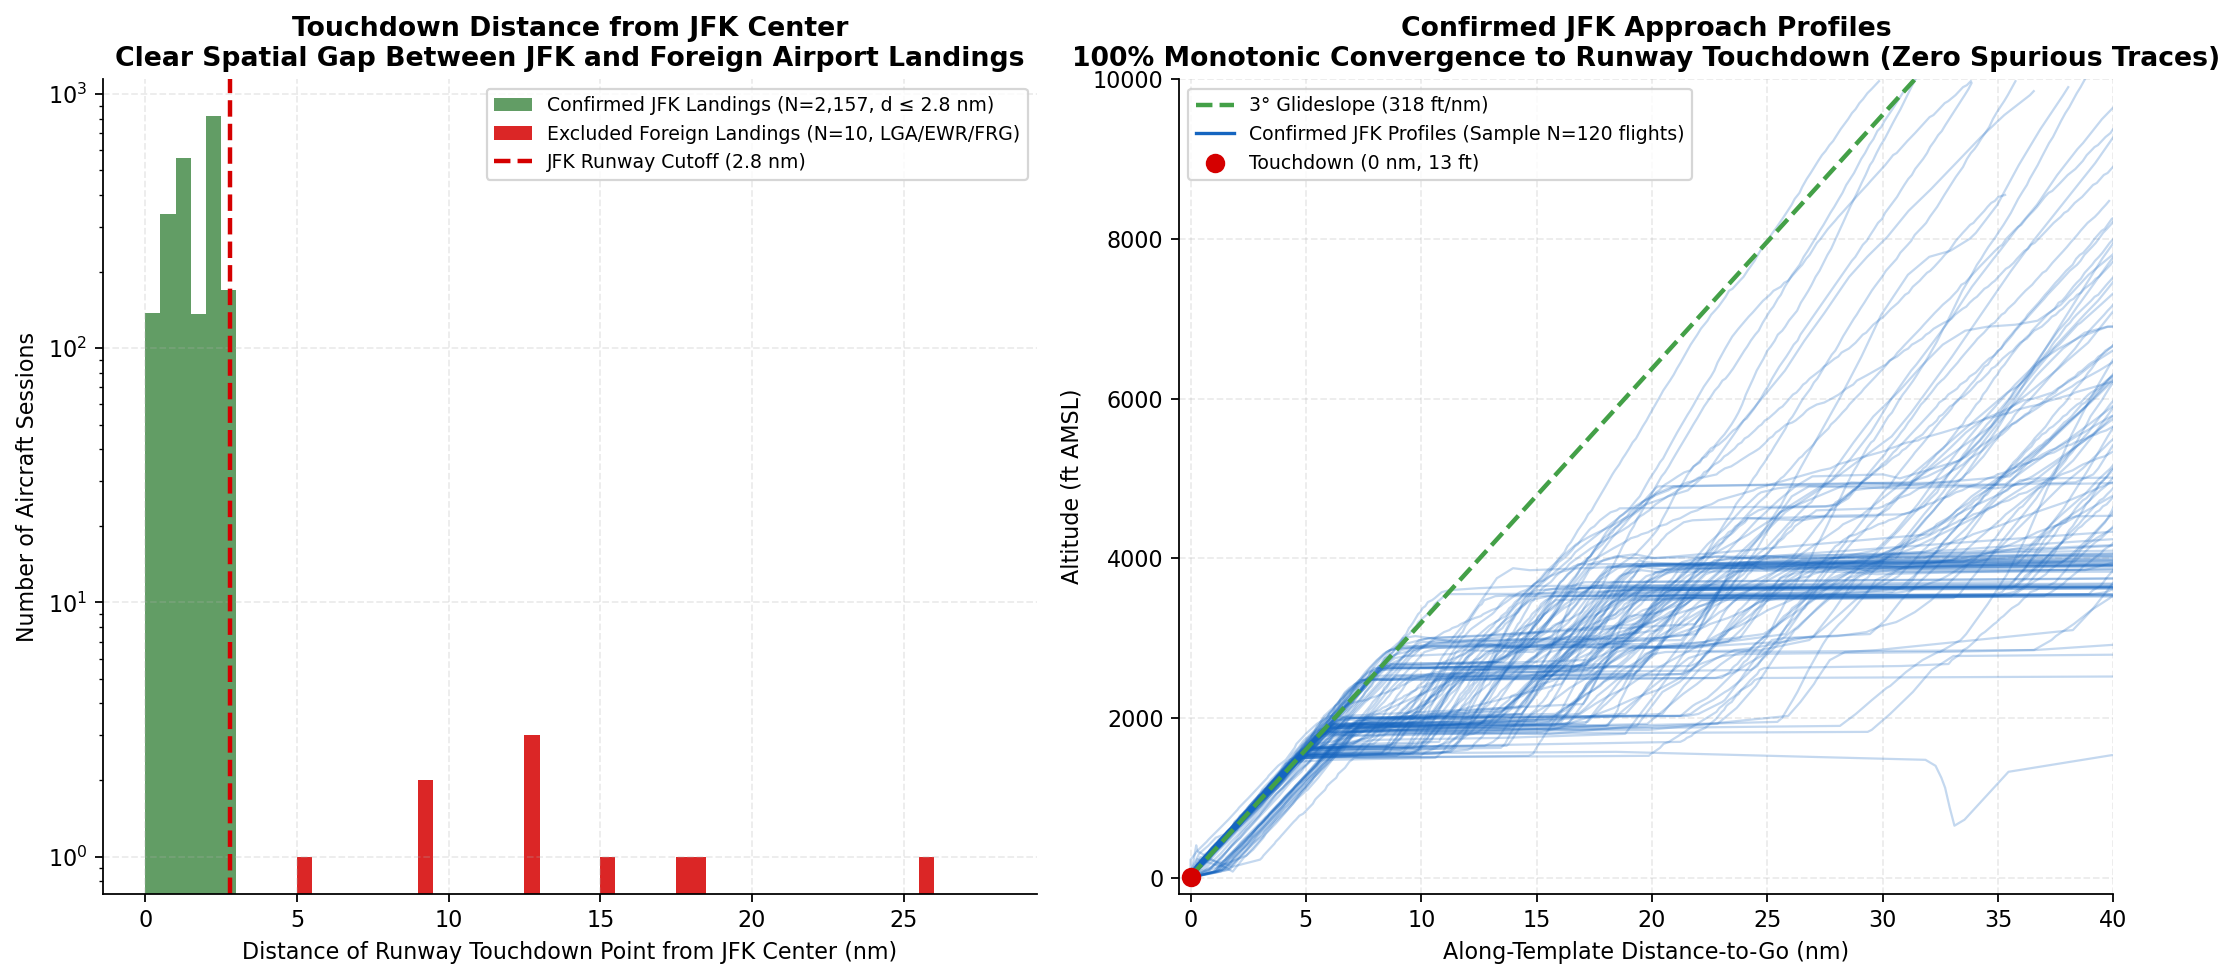
Raw arrival queries swept in departure climb-outs and landings at neighboring regional airfields (LGA, EWR, FRG).
To isolate genuine JFK arrivals, I audited touchdown coordinates against the airport center point. JFK runway thresholds extend at most 2.68 nm from the center point (specifically Runways 22L and 31L).
As shown above, an empirical scan revealed a complete 2.4 nm physical void between 2.68 nm and 5.1 nm with zero landing events before Floyd Bennett Field appears. Setting a strict cutoff at $d_{\text{touchdown}} \le 2.8\text{ nm}$, combined with departure and taxi filters, removed 92 climb-outs, 90 taxi runs and 10 foreign landings.
This isolated 2,157 confirmed JFK landings (288,064 deduplicated profile points) that converge monotonically to touchdown.
Per-row multi-label action classification #
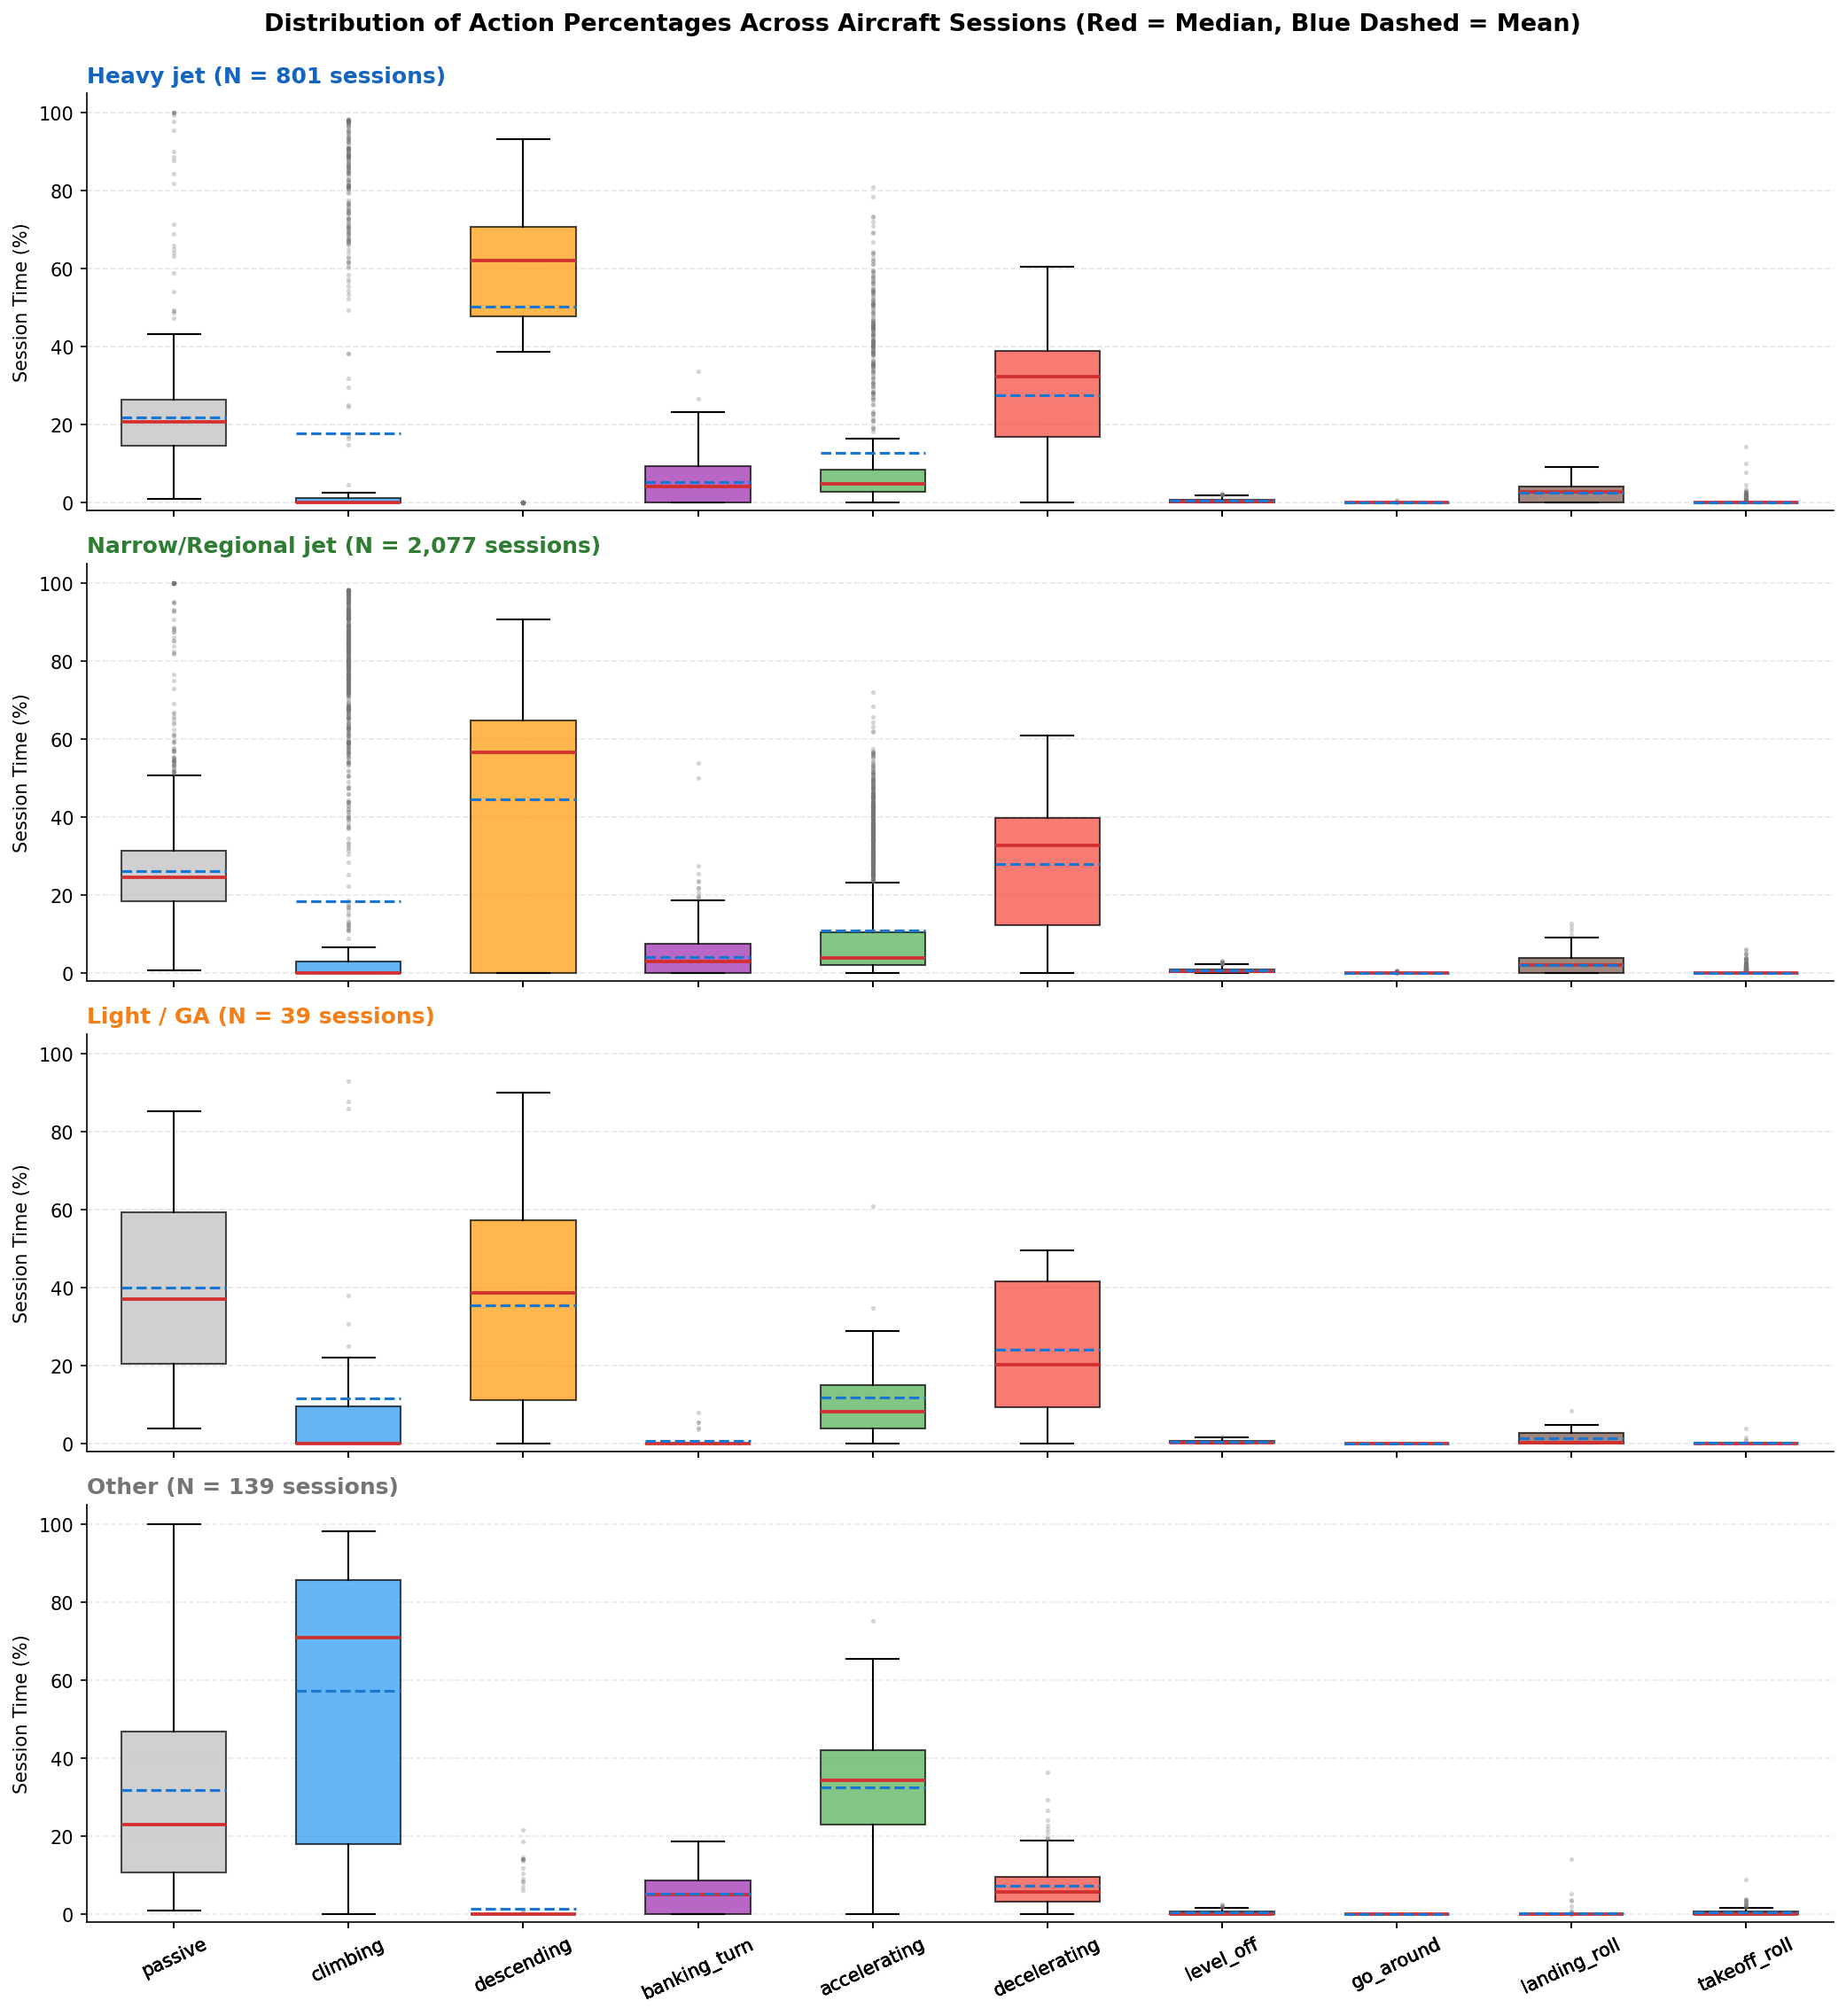
In 02-Preprocessing/action_labels.py, I implemented a per-row action classifier to capture aircraft maneuvers:
- Banking turns: Roll angle exceeding category limits (5° heavy, 8° narrow, 10° light) or track rate over $1.5^\circ/\text{s}$.
- Vertical rates: Climbs ($> +300\text{ fpm}$) or descents ($< -300\text{ fpm}$) from smoothed vertical speed.
- Speed dynamics: Acceleration or deceleration beyond $\pm 5\text{ kt}$ over a trailing 30-second window.
- Phase events: Level-offs, go-arounds and landing rollouts.
Heavy aircraft have larger turn radii and establish on localizer courses earlier, spending less session time turning than light aircraft.
Approach corridors from quantile regression #
With clean JFK landings parameterized by along-template distance-to-go ($d$), I fit linear quantile regression models at $q = 0.025$ and $q = 0.975$:
\[\text{Altitude}(d) = \beta_0^{(q)} + \beta_1^{(q)} \cdot d\]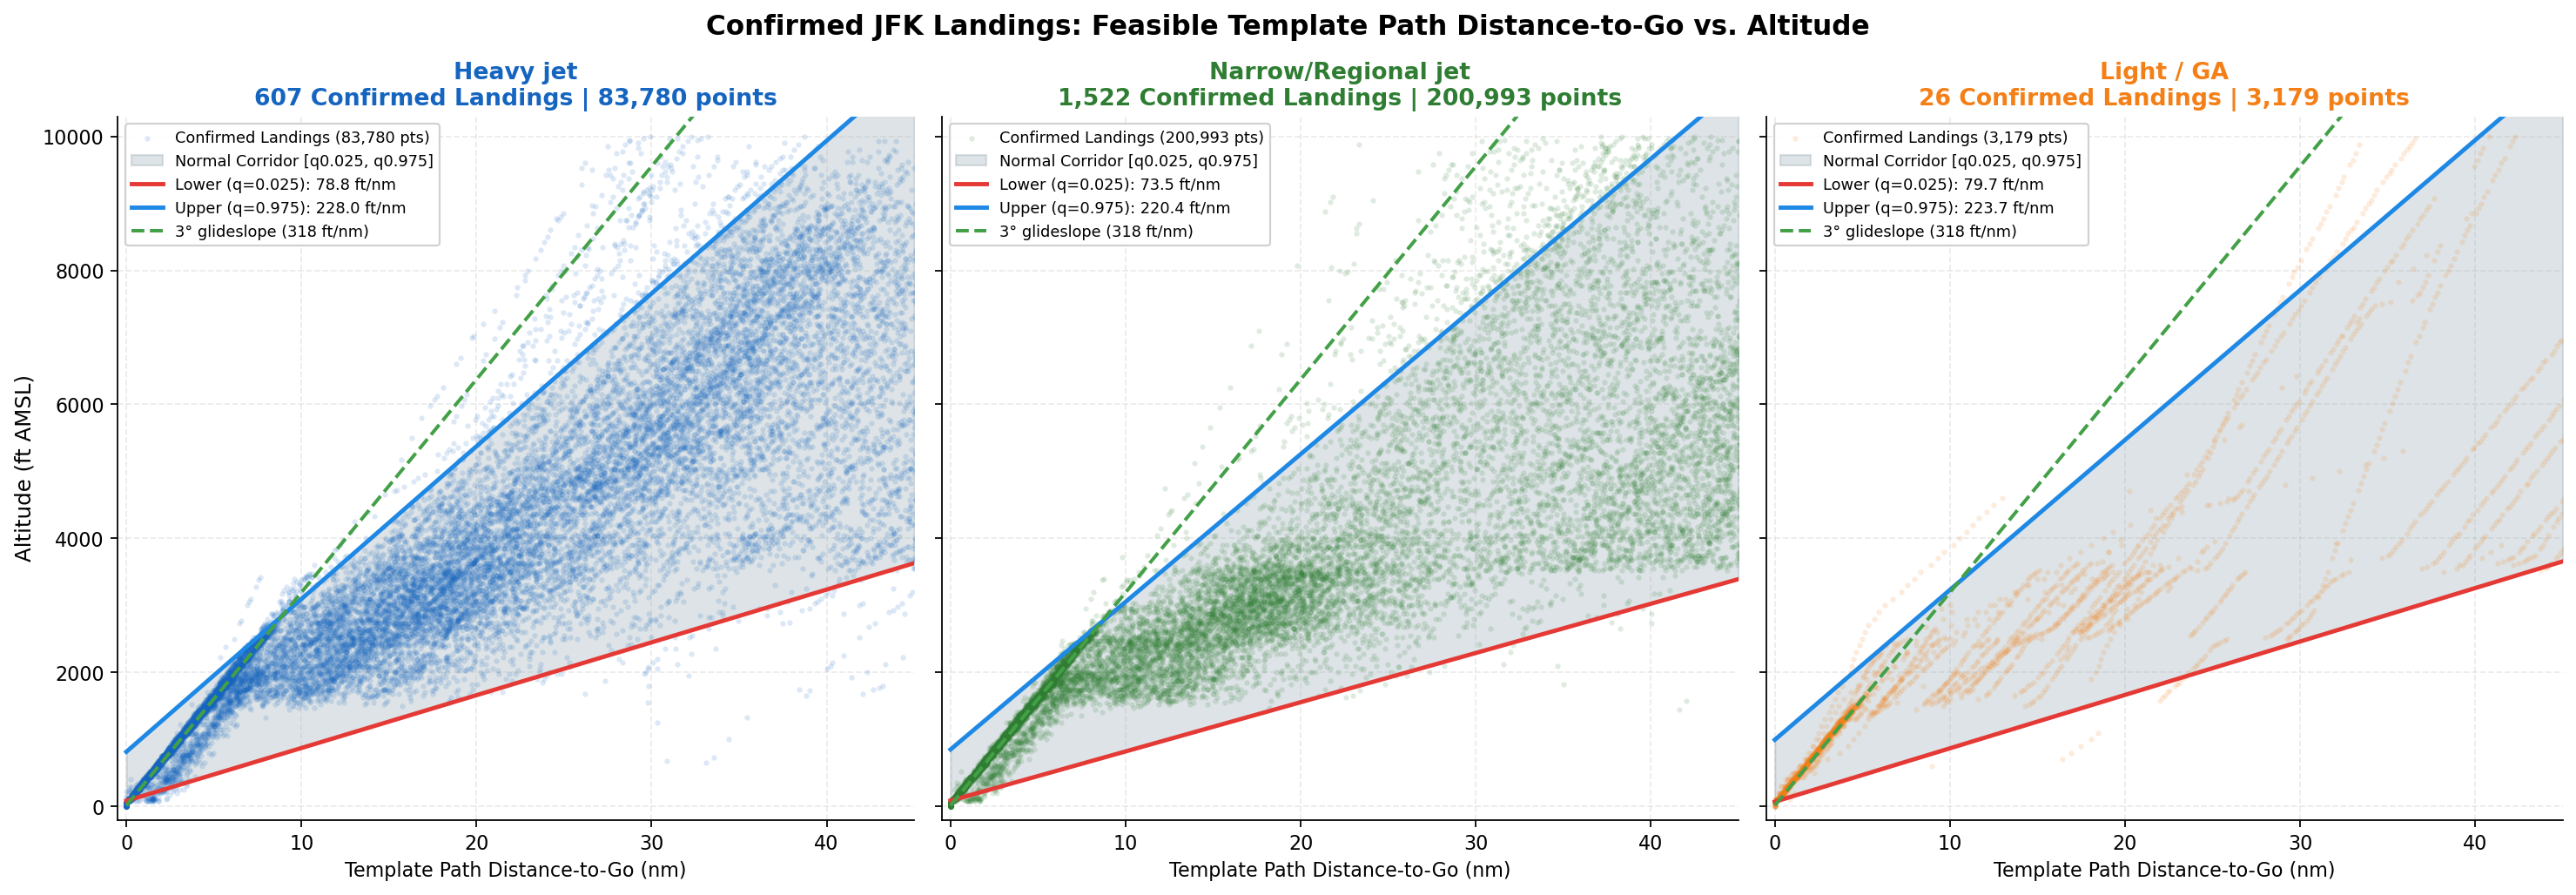
| Aircraft Category | Points ($N$) | Sessions | Lower Corridor ($q = 0.025$) | Upper Corridor ($q = 0.975$) |
|---|---|---|---|---|
| Heavy jet | 83,780 | 607 | $\text{Alt} = 82.4 + 78.83 \cdot d$ | $\text{Alt} = 814.2 + 228.03 \cdot d$ |
| Narrow/Regional jet | 200,993 | 1,522 | $\text{Alt} = 85.1 + 73.47 \cdot d$ | $\text{Alt} = 849.2 + 220.43 \cdot d$ |
| Light / GA | 3,179 | 26 | $\text{Alt} = 68.9 + 79.70 \cdot d$ | $\text{Alt} = 993.4 + 223.74 \cdot d$ |
The parameters reflect FAA procedures at JFK, where precision runways have a $3.00^\circ$ glide path angle ($318.44\text{ ft/nm}$) and threshold crossing heights of $\approx 68\text{ ft}$ AMSL. Lower slopes ($73.5\text{–}78.8\text{ ft/nm}$, or $\approx 0.7^\circ$) model arrival level-offs, while upper slopes ($220.4\text{–}228.0\text{ ft/nm}$, or $\approx 2.1^\circ$) bound high-energy descents prior to final capture.
Corridor compliance and outliers #
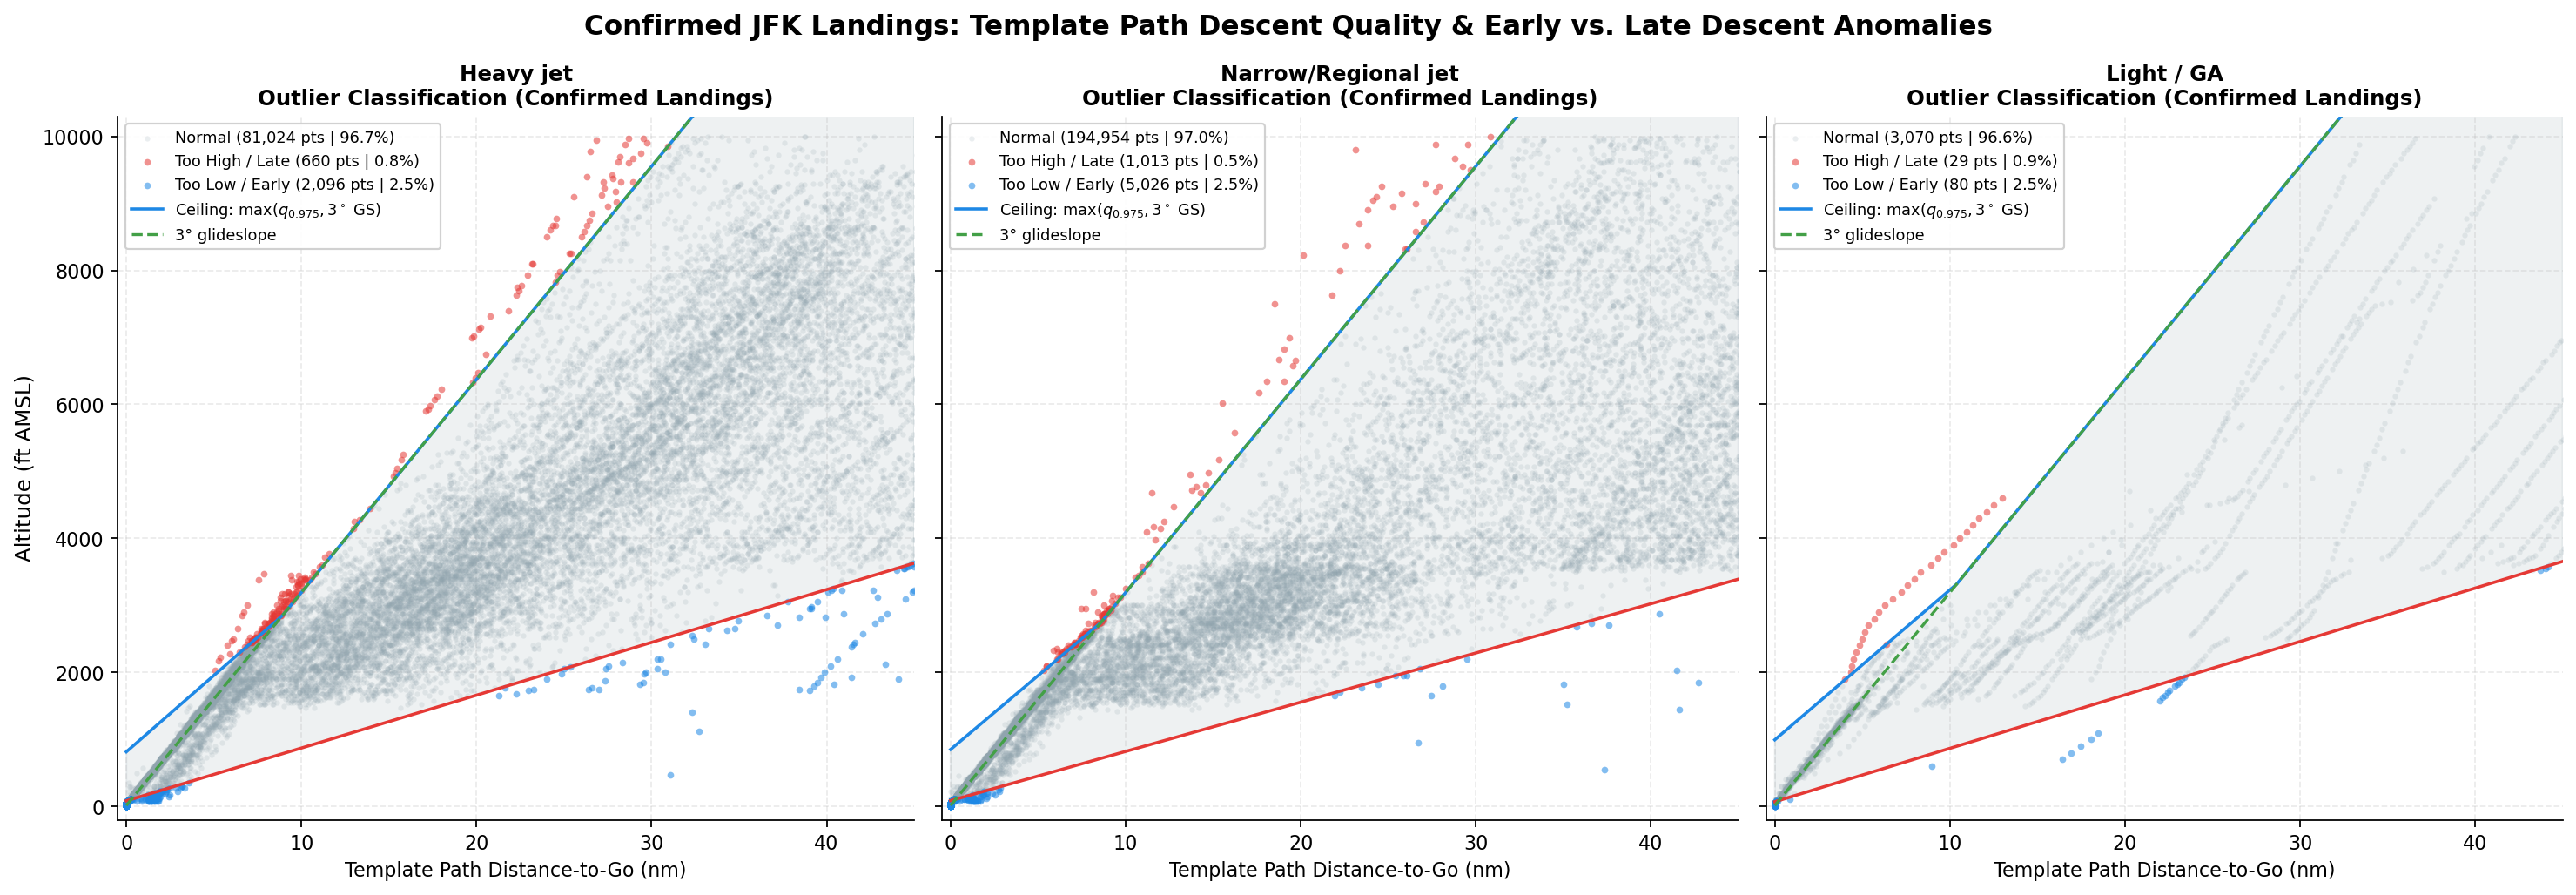
Because aircraft often level off at intermediate altitudes before capturing final approach, empirical $q_{0.975}$ slopes ($\approx 2.1^\circ$) are flatter than the standard 3.0° glide path ($318\text{ ft/nm}$). Beyond 8 nm from touchdown, a flight descending on a nominal 3.0° glide path would sit higher than the raw 97.5th percentile.
To avoid flagging nominal descents as anomalous, I defined the upper boundary as $\max(q_{0.975}, 3.0^\circ\text{ GS})$.
Under this combined ceiling:
- Point compliance reaches 96.9% across all categories, with 0.6% classified as high/late descent and 2.5% as low/early descent.
- Inside rates by category are 96.7% for heavy jets, 97.0% for narrow-body aircraft and 96.6% for light aircraft.
- Mean session adherence is 96.0% for heavy jets, 96.4% for narrow-body jets and 92.6% for light aircraft.
Next, I will incorporate these template trajectories and quantile envelopes directly into the reinforcement learning state space to penalize corridor breaches and speed deviations. With valid paths and physical boundaries established, the agent can learn realistic throttle, heading and descent controls for multi-aircraft sequencing. That will bridge the gap between static trajectory analysis and an active closed-loop terminal controller.
The pipeline scripts (01-final_approach_qr.py, 02-profile_descent_qr.py, 03-profile_template_qr.py) and datasets are in the FlightPathAnalysis repo.